
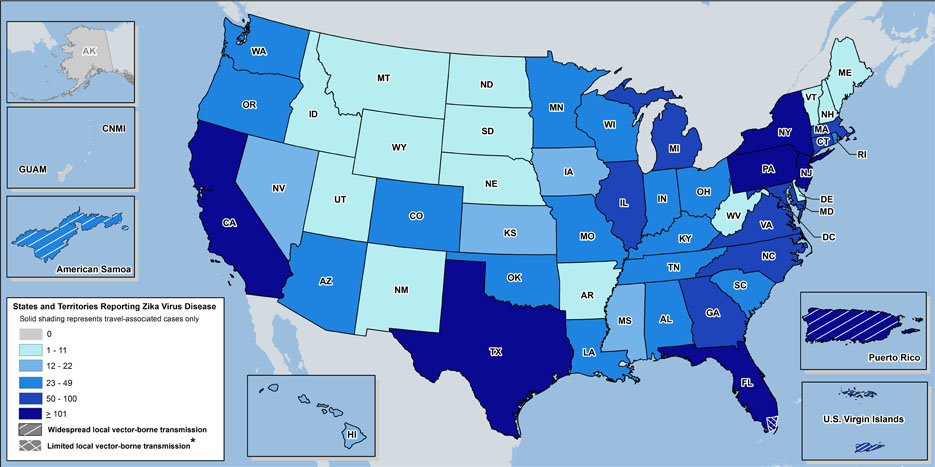
Laboratory-confirmed Zika virus disease cases reported to ArboNET by state or territory — United States, 2015–2016 (as of September 14, 2016)§
| States | Travel-associated cases* No. (% of cases in states) (N=3,133) |
Locally acquired cases† No. (% of cases in states) (N=43) |
|---|---|---|
| Alabama | 24 (1) | 0 (0) |
| Arizona | 29 (1) | 0 (0) |
| Arkansas | 10 (<1) | 0 (0) |
| California | 224 (7) | 0 (0) |
| Colorado | 32 (1) | 0 (0) |
| Connecticut | 58 (2) | 0 (0) |
| Delaware | 11 (<1) | 0 (0) |
| District of Columbia | 17 (1) | 0 (0) |
| Florida | 596 (19) | 43 (100) |
| Georgia | 78 (2) | 0 (0) |
| Hawaii | 12 (<1) | 0 (0) |
| Idaho | 3 (<1) | 0 (0) |
| Illinois | 58 (2) | 0 (0) |
| Indiana | 32 (1) | 0 (0) |
| Iowa | 16 (1) | 0 (0) |
| Kansas | 13 (<1) | 0 (0) |
| Kentucky | 23 (1) | 0 (0) |
| Louisiana | 29 (1) | 0 (0) |
| Maine | 11 (<1) | 0 (0) |
| Maryland | 95 (3) | 0 (0) |
| Massachusetts | 67 (2) | 0 (0) |
| Michigan | 52 (2) | 0 (0) |
| Minnesota | 47 (2) | 0 (0) |
| Mississippi | 21 (1) | 0 (0) |
| Missouri | 26 (1) | 0 (0) |
| Montana | 7 (<1) | 0 (0) |
| Nebraska | 8 (<1) | 0 (0) |
| Nevada | 14 (<1) | 0 (0) |
| New Hampshire | 8 (<1) | 0 (0) |
| New Jersey | 116 (4) | 0 (0) |
| New Mexico | 6 (<1) | 0 (0) |
| New York | 685 (22) | 0 (0) |
| North Carolina | 61 (2) | 0 (0) |
| North Dakota | 1 (<1) | 0 (0) |
| Ohio | 36 (1) | 0 (0) |
| Oklahoma | 26 (1) | 0 (0) |
| Oregon | 23 (1) | 0 (0) |
| Pennsylvania†† | 102 (3) | 0 (0) |
| Rhode Island | 29 (1) | 0 (0) |
| South Carolina | 31 (1) | 0 (0) |
| South Dakota | 1 (<1) | 0 (0) |
| Tennessee | 39 (1) | 0 (0) |
| Texas | 181 (6) | 0 (0) |
| Utah | 11** (<1) | 0 (0) |
| Vermont | 7 (<1) | 0 (0) |
| Virginia | 81 (3) | 0 (0) |
| Washington | 34 (1) | 0 (0) |
| West Virginia | 11 (<1) | 0 (0) |
| Wisconsin | 29 (1) | 0 (0) |
| Wyoming | 2 (<1) | 0 (0) |
| Territories | Travel-associated cases* No. (% of cases in territories) (N=65) |
Locally acquired cases† No. (% of cases in territories) (N=17,629) |
| American Samoa | 0 (0) | 47 (<1) |
| Puerto Rico | 64 (98) | 17,315*** (98) |
| US Virgin Islands | 1 (2) | 265 (2) |
§Only includes cases meeting the probable or confirmed CSTE case definition and does not include asymptomatic infections unless the case is a pregnant woman with a complication of pregnancy
*Travelers returning from affected areas, their sexual contacts, or infants infected in utero
†Presumed local mosquito-borne transmission
††One additional case acquired through laboratory transmission
**Includes one case with unknown route of person-to-person transmission.
***The Puerto Rico Department of Health is retroactively reporting cases, resulting in larger than normal increases in cases in recent weeks.
